With tonight’s Sapling activation, and growing wallet support in coming months, there’s going to be strong continuing discussion & media coverage of the Sapling performance improvements.
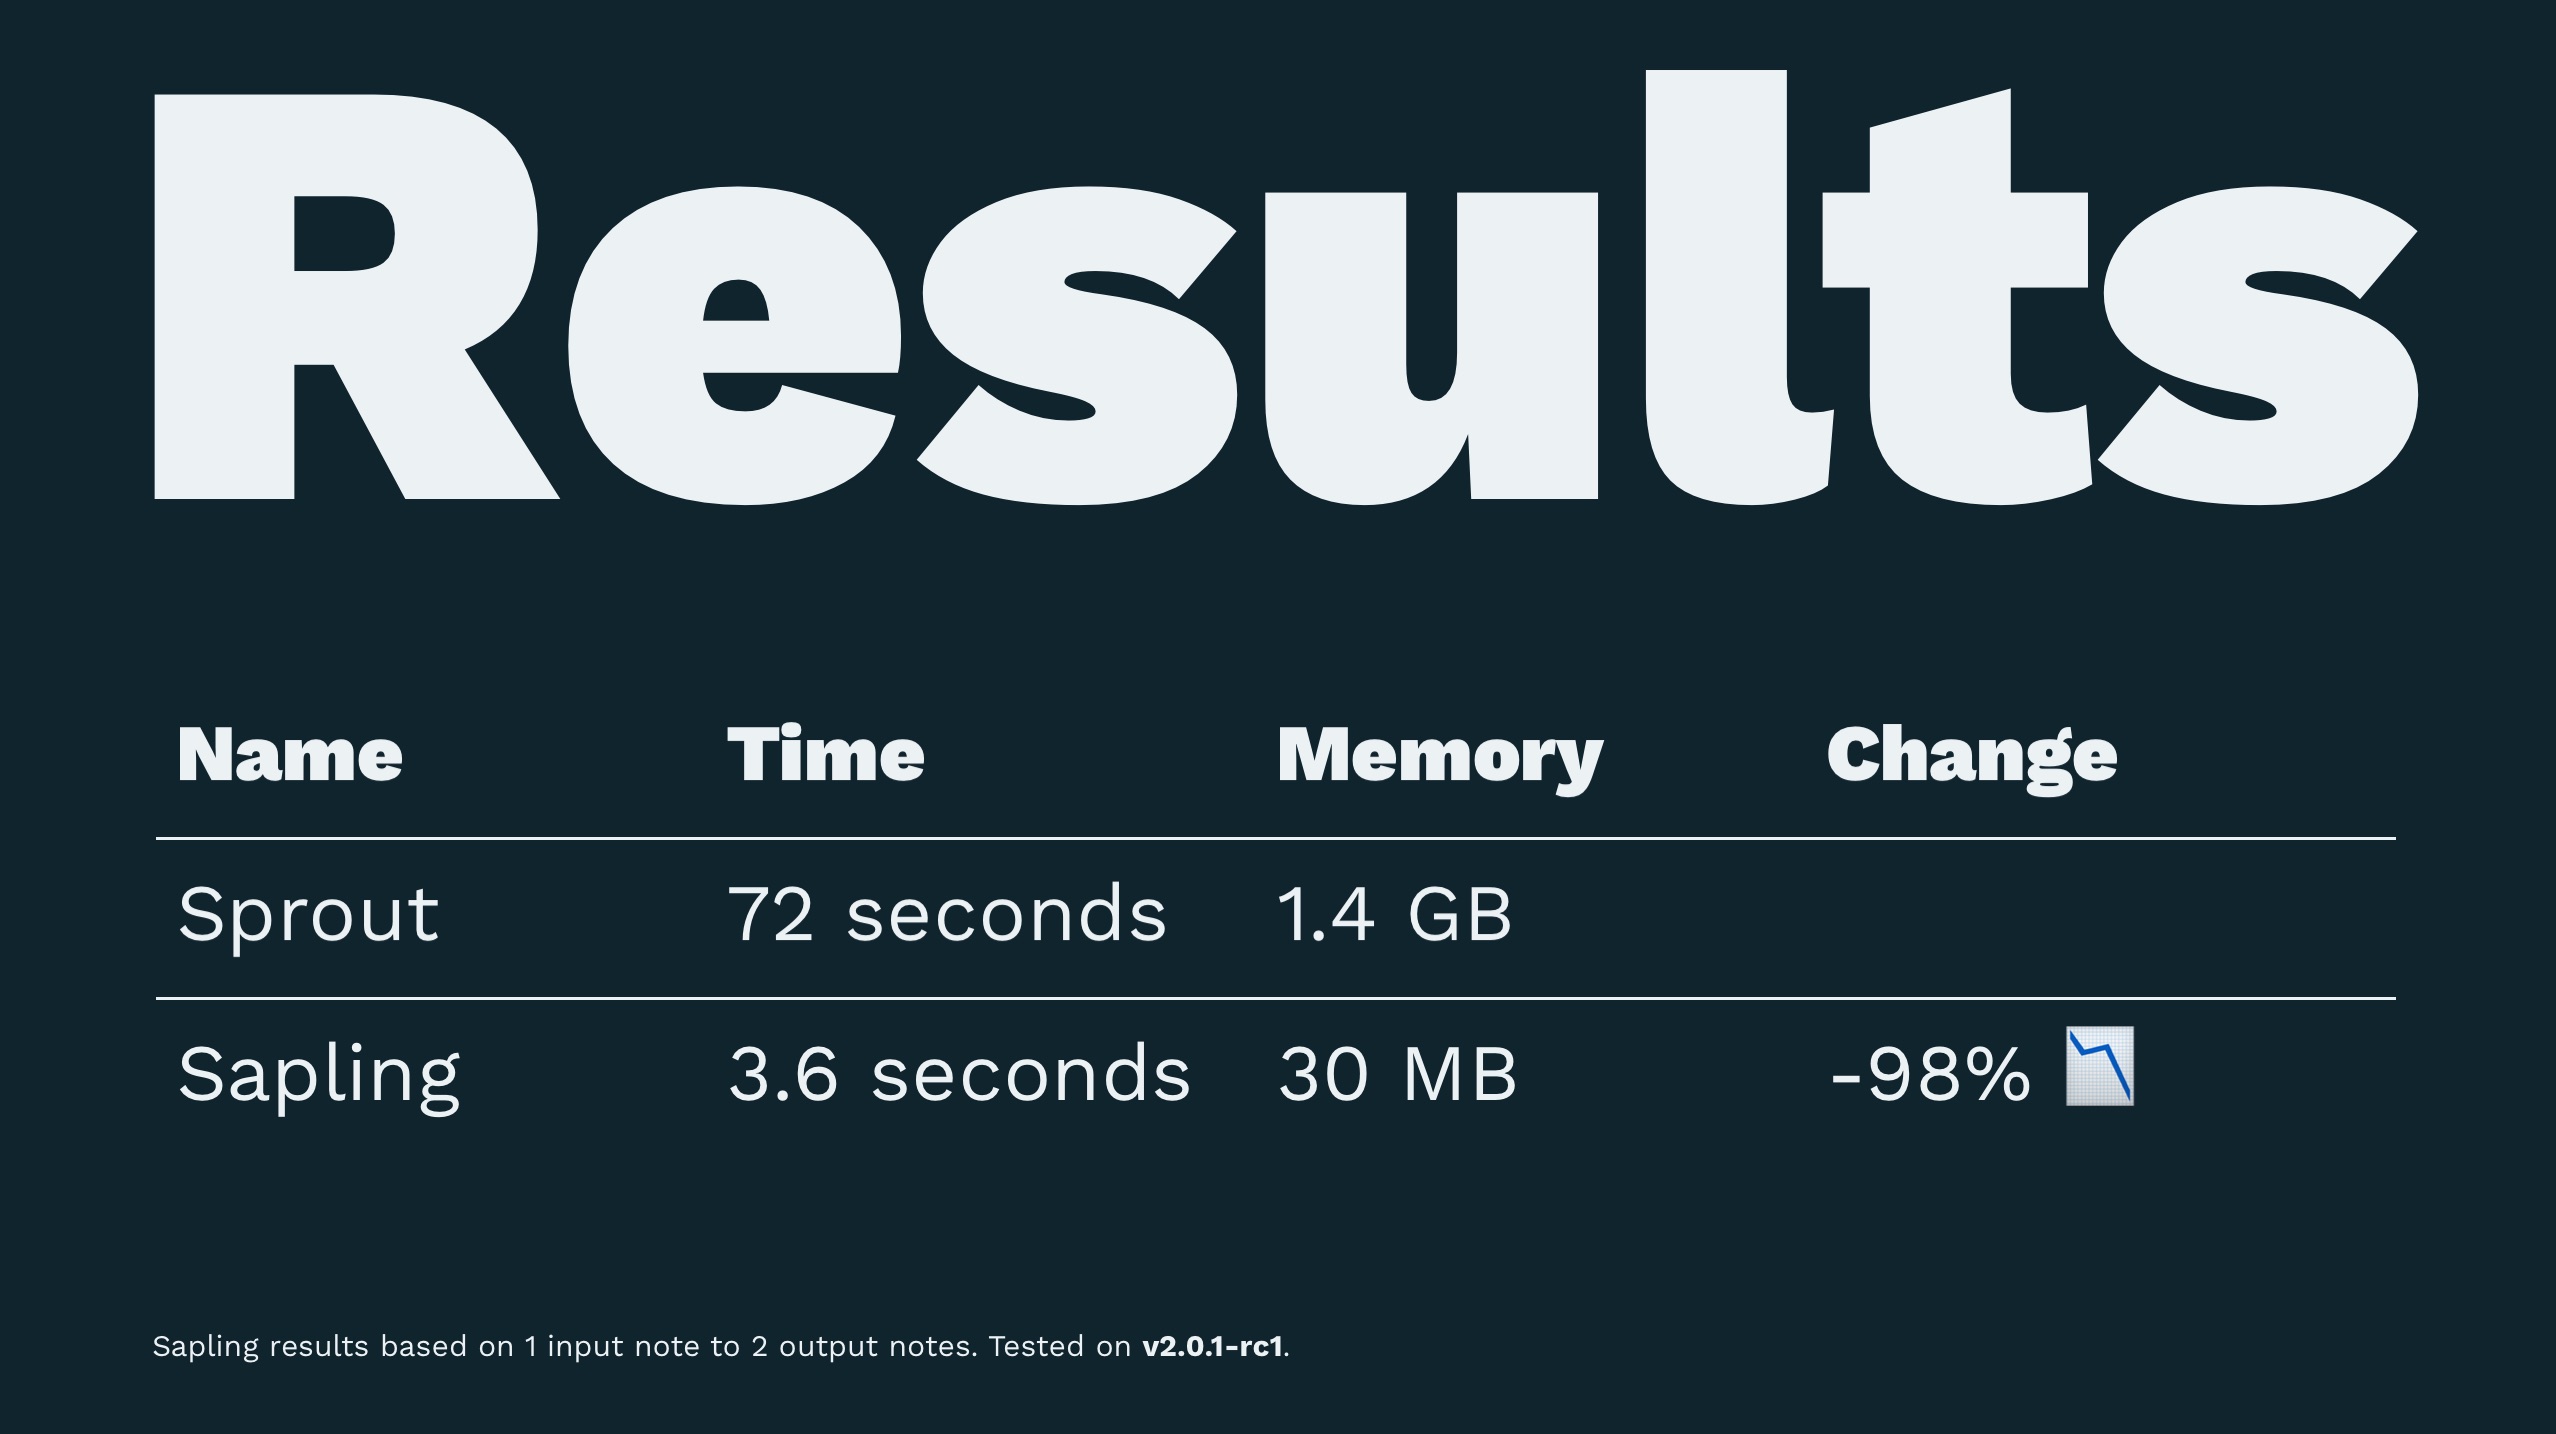
Many have used, and are likely to keep using, this graphic from the Zcash ‘Cultivating Sapling’ blog post:

Unfortunately, these radial gauges are weak at communicating the magnitude of the changes, and the usability implications. For example, there’s no proportional contrast between large- and small- RAM consumption - just pegged needles pointing ~180’ different directions. The 90’ difference in duration values is similarly arbitrary, based on choice-of-ranges. And dominating red-yellow-green colored-regions imply some ‘acceptability’ judgement, but based on unclear criteria, and unrelated to the space-taken-up.
This same info, in another graphic presentation, could be more impactful, and such a graphic likely get wide re-use among those reporting/blogging/tweeting about Sapling improvements.
I have some strong ideas for this alternative view, but not quite the graphical skills & time to get it right. So I wanted to share ideas here for those who might be able to take it up.
In particular:
-
Durations are well-indicated linearly, such as by horizontal bars of contrasting proportional lengths. (Time is often naturally understood graphically as a left-to-right ‘timeline’.)
-
Resource utilization, as with RAM, is well-indicated as contrasting, inscribed areas. (This matches the physicality of memory-mediums, in chips or storage-media-surfaces, and the need for implementations to "fit inside’ a certain amount of ‘memory space’.)
But even further:
-
What is an acceptable transaction delay for payment applications? Well, the chip-card standard now rolled out at retail terminals in the US is called “EMV”. UL did a real-world study of chip-card transaction times, and found an average duration of 11 seconds.
-
What’s the most relevant RAM capacity for mass usage? Even low-end smartphones have 512MiB.
Adding these two outside benchmark values – perhaps as lower-contrast reference indicators – hammers home the messages: Sapling speed-to-transaction-visible-on-network is competitive with legacy centralized systems, and Sapling resource requirements fit within mass-market phones.
As a really-simple ascii-fication of this:
ZCASH SHIELDED-SEND TIME/MEMORY
'Sprout' (1st-gen October 2016) vs 'Sapling' (2nd-gen: October 2018)

Transaction ('Proof') Creation Time

 Zcash Sapling: ******* 7 seconds
EMV chip-cards: *********** 11 seconds
  Zcash Sprout: ************************************* 37 seconds

Device Memory Required

#Sapling##---------x---------x-+-------x---------x---------x
#40 MiB###                     |                           |
|                              |                           |
|                              |                           |
x                              x                           x
|                       Phones |                           |
|                       512MiB |                           |
|--------x---------x---------x-+                           |
|                                                          |
x                                                          x
|                                                          |
|                                                          |
|                                                          |
|                                                          |
x                                                          x
|                                                          |
|                                                          |
|                                                 Sprout   |
|                                                 3000MiB  |
x--------x---------x---------x---------x---------x---------x
Anyone up for making this as a pretty PNG that’s easy to embed elsewhere? (For example, a 1024x512 image that will be displayed unclipped in tweets?)
- Gordon